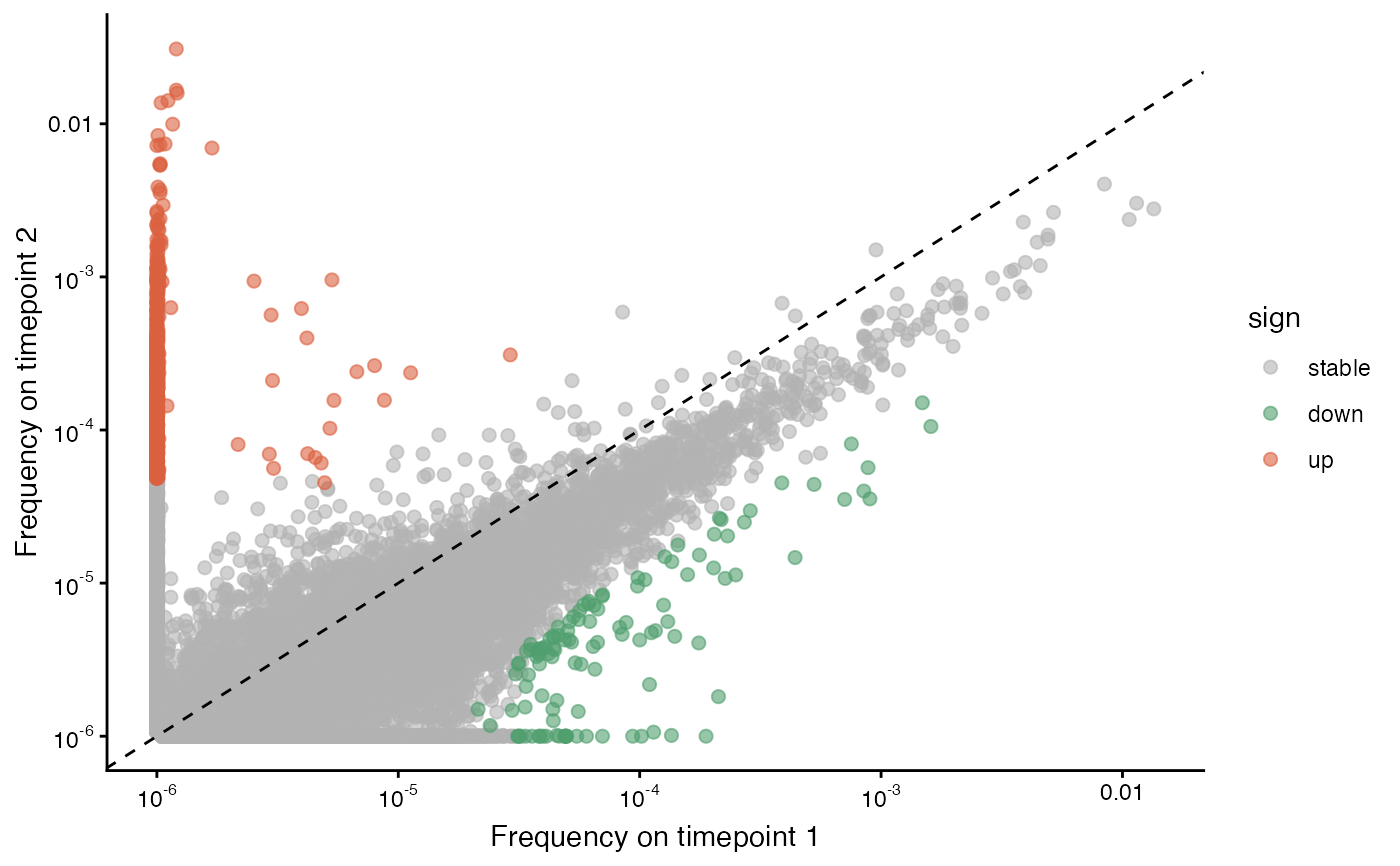
Scatterplot of TCR clone read fraction of clones between two samples
plot_sample_vs_sample.Rd![[Experimental]](figures/lifecycle-experimental.svg)
plot_sample_vs_sample() returns a scatterplot of read frequencies of TCRs between two samples.
The function labels each TCR as up-regulated, down-regulated, or stable, based on the log2 fold-change cutoff supplied (default 1.5).
Usage
plot_sample_vs_sample(
  data1,
  data2,
  chain = c("beta", "alpha"),
  log2fc_cutoff = 3,
  sem_cutoff = 2.5,
  pseudo1 = 1e-06,
  pseudo2 = 1e-06,
  labelx = "Frequency on timepoint 1",
  labely = "Frequency on timepoint 2",
  return_data = FALSE,
  smooth_sem = c("window", "none"),
  window_size = 30,
  end_window_size = 5,
  highlight_clones = c(),
  highlight_color = "red",
  interactive = FALSE
)
Arguments
- data1
a list of three data frames (alpha, beta, and paired) for one sample
- data2
a list of three data frames (alpha, beta, and paired) for one sample
- chain
which chain to plot, alpha or beta (default is beta)
- log2fc_cutoff
the log2 fold-change cutoff to call a TCR up- or down-regulated (default 1.5)
- sem_cutoff
the standard-error of the mean (SEM) to use as a cutoff in calling clones expanded or contracted (default is 2.5)
- pseudo1
the pseudocount to add to read frequency of the first sample (default is
10^-6).- pseudo2
the pseudocount to add to read frequency of the second sample (default is
10^-6).- labelx
the label for the x-axis
- labely
the label for the y-axis
- return_data
if TRUE, return the data frame used to make the plot rather than the plot itself.
- smooth_sem
if "window", then SEM values for clones will be smoothed by comparing to other clones within a window of similar frequencies. Otherwise, no smoothing. (default is "window")
- window_size
the number of similar clones to include within a window.
- end_window_size
the number of clones to include in a window at the ends (most and least frequent)
- highlight_clones
a vector of nucleotides of clones to highlight
- highlight_color
a color for highlighted clones
- interactive
whether to return an interactive plot (default FALSE)
Value
A scatterplot (ggplot object) with read frequencies (proportions), colored by whether each TCR is up-regulated, down-regulated, or neither, given the log2 fold-change cutoff.
If return_data is TRUE, the data frame used to make the plot is returned instead of the plot.
See also
Other longitudinal:
plot_clone_size_across_samples()
Examples
folder = system.file("extdata/SJTRC_TIRTL_seq_longitudinal",
  package = "TIRTLtools")
sjtrc = load_tirtlseq(folder,
  meta_columns = c("marker", "timepoint", "version"), sep = "_",
  verbose = FALSE)

plot_sample_vs_sample(sjtrc$data$cd8_tp1_v2, sjtrc$data$cd8_tp2_v2, chain = "beta")
#> Warning: Ignoring unknown aesthetics: text