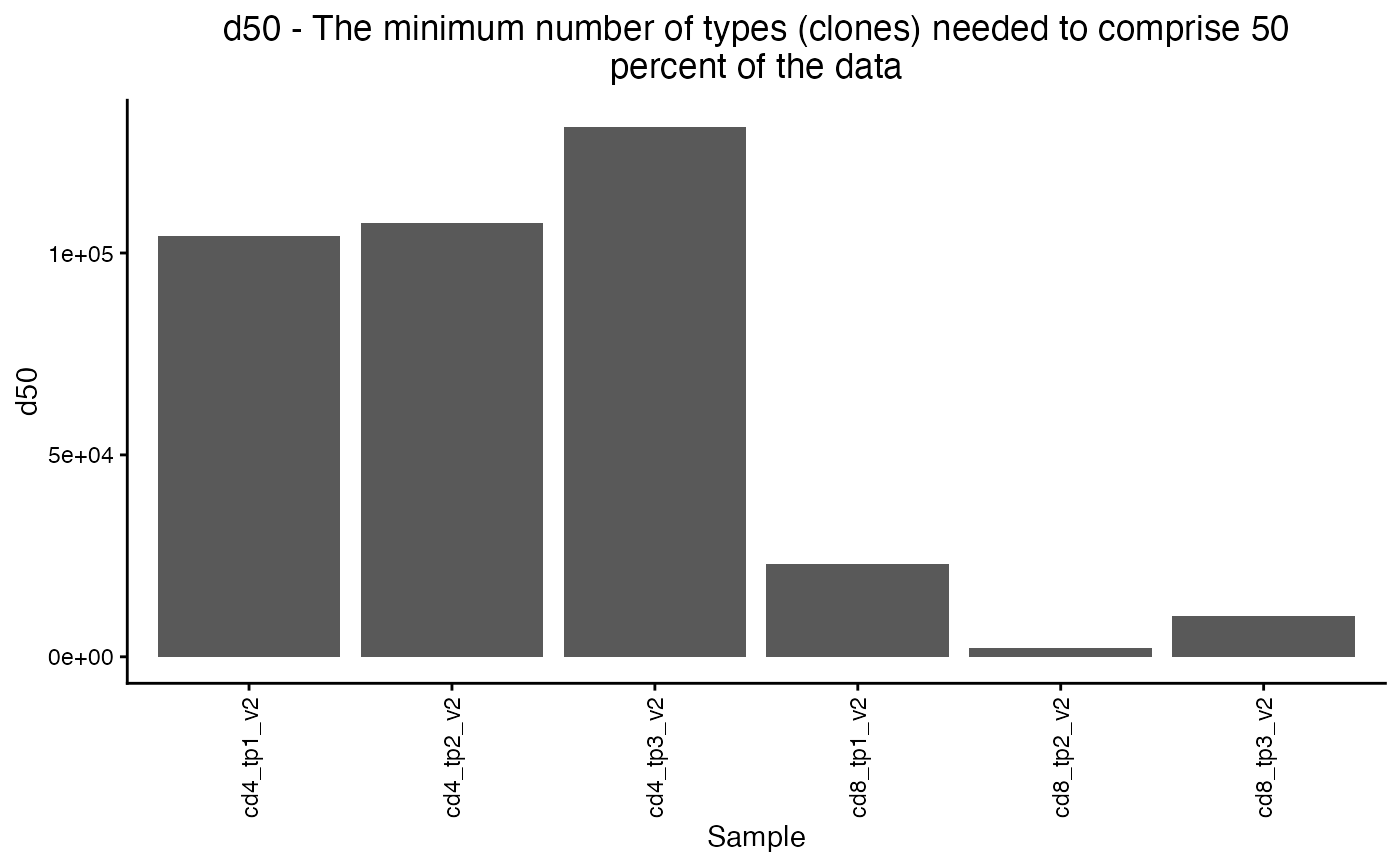
Bar plot of clonal diversity metrics
plot_diversity.Rd![[Experimental]](figures/lifecycle-experimental.svg) The
The plot_diversity() plots the requested clonal diversity metric
This function can plot a variety of clonal diversity metrics for a dataset (richness,
Simpson diversity index, Shannon-Wiener index, etc.). See get_all_div_metrics() for
all available options. By default it return a barplot with one bar for each sample in
the dataset. If a grouping column (of the metadata) is supplied, then samples will be grouped and
bar heights will reflect the average diversity metric across the group, with error bars
showing the standard deviation.
Usage
plot_diversity(
  div,
  metric = get_all_div_metrics(),
  q = 2,
  percent = 90,
  group_col = NULL,
  label_col = "Sample",
  flip = FALSE,
  facet = FALSE,
  log_scale = FALSE,
  samples = NULL,
  return_data = FALSE,
  color_scheme = NULL,
  x_var = NULL
)
Arguments
- div
a list created by the
calculate_diversity()function with diversity metrics for each sample- metric
the diversity metric to use (e.g. shannon, simpson, etc.)
- q
(optional) for 'renyi' and 'hill' metrics, the order q of the diversity index
- percent
(optional) for 'dXX' metric, the percentage 'XX' between 0 and 100
- group_col
(optional) if supplied, a column of the metadata that will be used to group samples
- label_col
(optional) labels for the samples
- flip
(optional) if TRUE, flip the x and y-axes (default is FALSE)
- facet
(optional) if TRUE, plot with separate facets, or sub-plots for each group (default is FALSE)
- log_scale
(optional) if TRUE, use log-scale for the y-axis (default is FALSE)
- samples
(optional) the samples to include in the plot (default is all samples)
- return_data
(optional) if TRUE, return the data used to make the plot (default is FALSE)
- color_scheme
(optional) a color scheme for the plot
- x_var
(optional) the variable to show on the x-axis, if other than "sample_id"
Value
A list with two objects:
$plot - a ggplot object with the plot of the requested diversity metric
$data - if return_data is TRUE, the data frame used to make the plot
Examples
folder = system.file("extdata/SJTRC_TIRTL_seq_longitudinal",
  package = "TIRTLtools")
sjtrc = load_tirtlseq(folder,
  meta_columns = c("marker", "timepoint", "version"), sep = "_",
  verbose = FALSE)

div = calculate_diversity(sjtrc, chain = "beta", metrics = "d50")
#>
#> -- Calculating diversity indices for sample 1 of 6.
#> -- Calculating diversity indices for sample 2 of 6.
#> -- Calculating diversity indices for sample 3 of 6.
#> -- Calculating diversity indices for sample 4 of 6.
#> -- Calculating diversity indices for sample 5 of 6.
#> -- Calculating diversity indices for sample 6 of 6.
plot_diversity(div, metric = "d50")