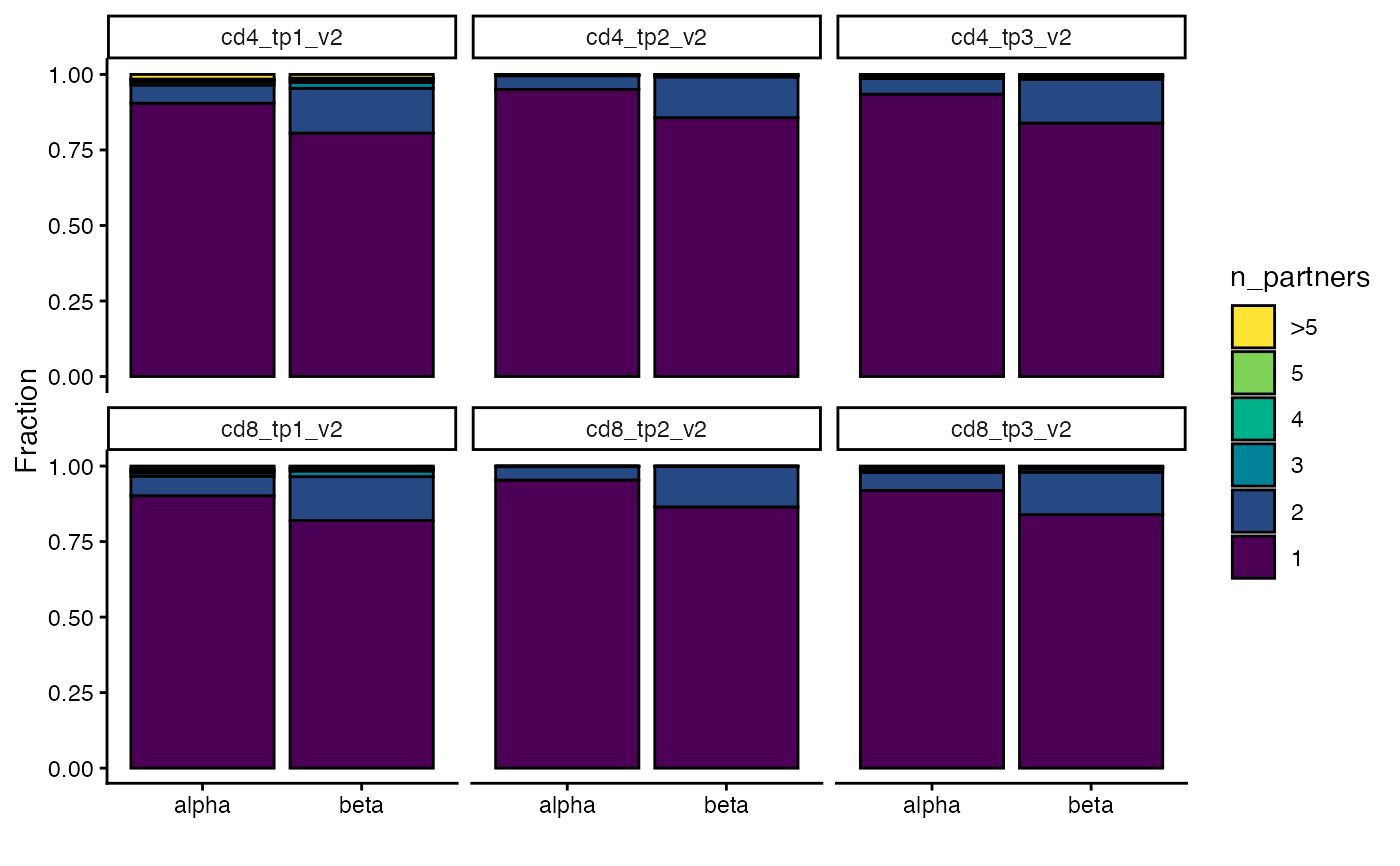
Stacked bar plot of the fraction of alpha/beta chains with different numbers of partners
plot_num_partners.Rd![[Experimental]](figures/lifecycle-experimental.svg)
plot_num_partners() creates bar plots for alpha and beta chains showing how many
partners they are paired with by the MAD-HYPE and/or T-shell algorithms.
Usage
plot_num_partners(
  data,
  group_col = NULL,
  fraction = TRUE,
  include_non_functional = FALSE,
  max_partners = 5,
  samples = NULL,
  return_data = FALSE,
  color_scheme = NULL
)
Arguments
- data
a TIRTLseqDataSet object
- group_col
a column of the metadata to use to group multiple samples into one bar plot The default is NULL, which uses the sample id.
- fraction
whether to plot the fraction of chains or the total number of chains (default is TRUE, i.e. plot fractions)
- include_non_functional
whether to include chains with non-functional cdr3 sequences when tabulating the output.
- max_partners
the maximum number of partners, N, to include in the plots. All chains with more than N partners will be grouped together under the ">N" category.
- samples
(optional) which samples to plot
- return_data
if TRUE, return the data used to make the plots
- color_scheme
the color scheme to use for the plot
Value
A bar chart (ggplot object) with facets (sub-plots) for each sample.
If return_data is TRUE, the data frame used to create the plot is returned instead.
Details
For each sample, the function creates stacked bar charts for alpha and beta chains, showing the proportion of them (among all called pairs) that are paired with 1 chain, 2 chains, 3 chains, etc.
See also
identify_non_functional_seqs()
Other qc:
get_all_tcrs(),
get_pair_stats(),
get_paired_by_read_fraction_range(),
plot_n_reads(),
plot_paired(),
plot_paired_by_read_fraction_range(),
plot_paired_vs_rank(),
plot_pairs_with_eachother(),
plot_ranks(),
plot_read_fraction_vs_pair_status(),
plot_sample_overlap(),
summarize_data()
Examples
folder = system.file("extdata/SJTRC_TIRTL_seq_longitudinal",
  package = "TIRTLtools")
ts_data = load_tirtlseq(folder,
  meta_columns = c("marker","timepoint", "version"),
  sep = "_", verbose = FALSE)

plot_num_partners(ts_data)