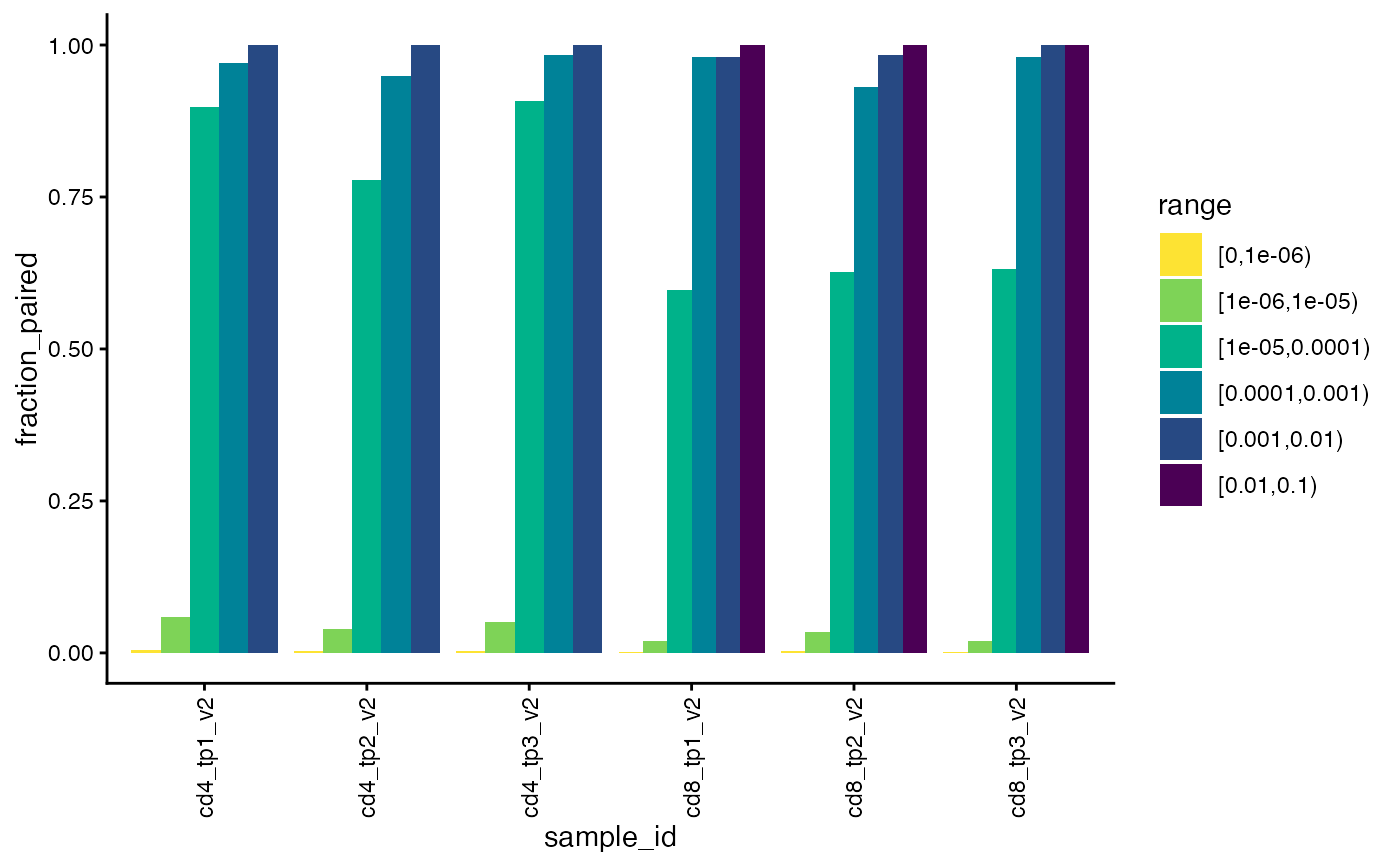
Bar plot of the fraction of paired single chains by frequency
plot_paired_by_read_fraction_range.Rd![[Experimental]](figures/lifecycle-experimental.svg) This function returns a bar plot of the fraction of single-chains (alpha or beta, default is beta)
that were paired within different frequency ranges
(default is
This function returns a bar plot of the fraction of single-chains (alpha or beta, default is beta)
that were paired within different frequency ranges
(default is [10^-1, 10^-2], [10^-2, 10^-3], ... , [10^-5,10^-6], [10^-6, 0]) for each sample.
Usage
plot_paired_by_read_fraction_range(
  data,
  chain = c("beta", "alpha"),
  cutoffs = 10^(-6:-1),
  freq = FALSE,
  samples = NULL,
  color_scheme = NULL
)
Arguments
- data
a TIRTLseqDataSet object or a data frame created using
get_paired_by_read_fraction_range()- chain
the TCR chain to plot (default is "beta")
- cutoffs
a vector of cutoffs for the read fraction ranges
- freq
if TRUE, plot the number of pairs, if FALSE plot the fraction paired (default is FALSE, plot the fraction paired)
- samples
(optional) the samples to include in the plot
- color_scheme
(optional) the color scheme to use in the plot
Examples
folder = system.file("extdata/SJTRC_TIRTL_seq_longitudinal", package = "TIRTLtools")
ts_data = load_tirtlseq(folder, meta_columns = c("marker", "timepoint", "version"), sep = "_", verbose = FALSE)

plot_paired_by_read_fraction_range(ts_data, chain = "beta")