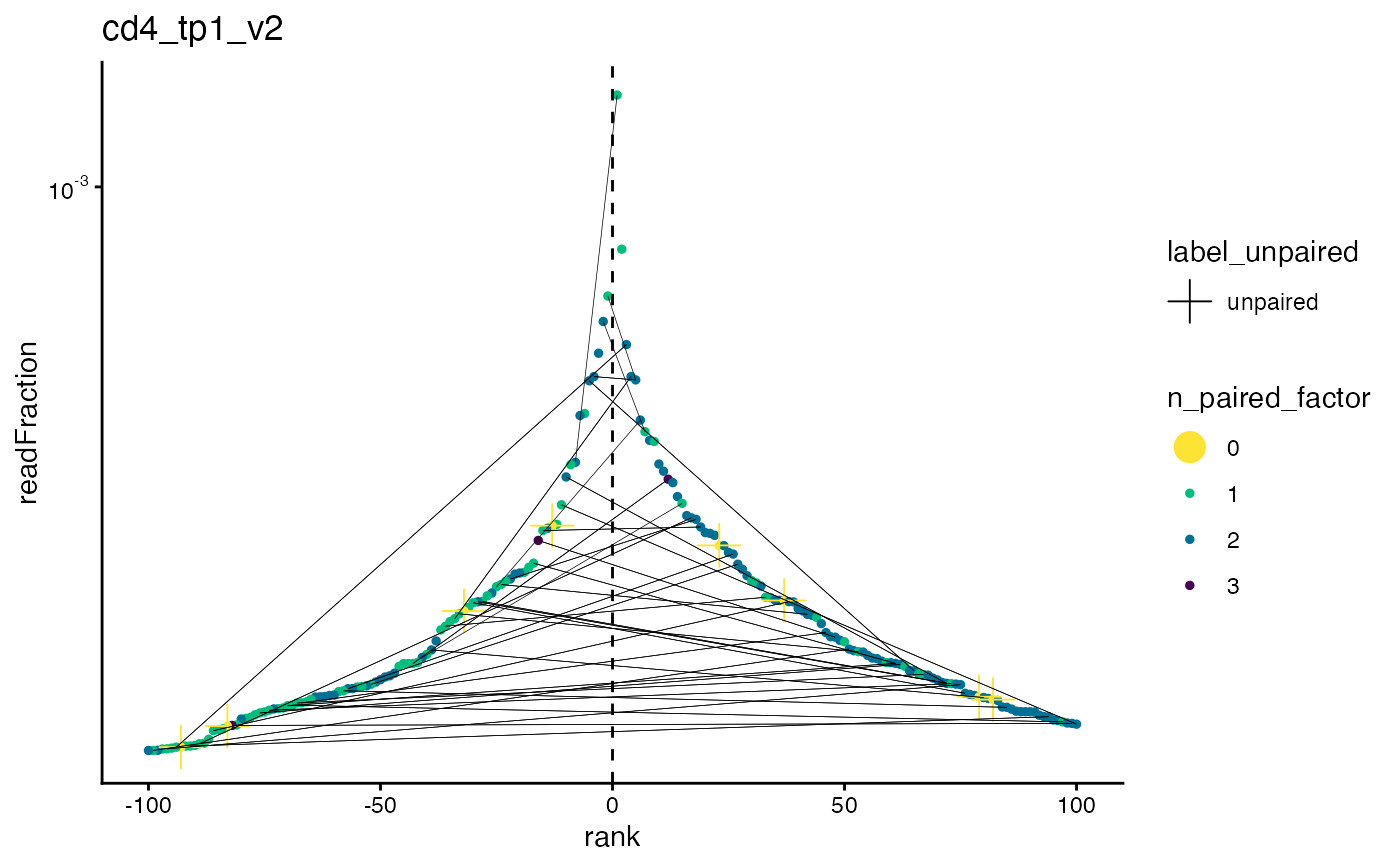
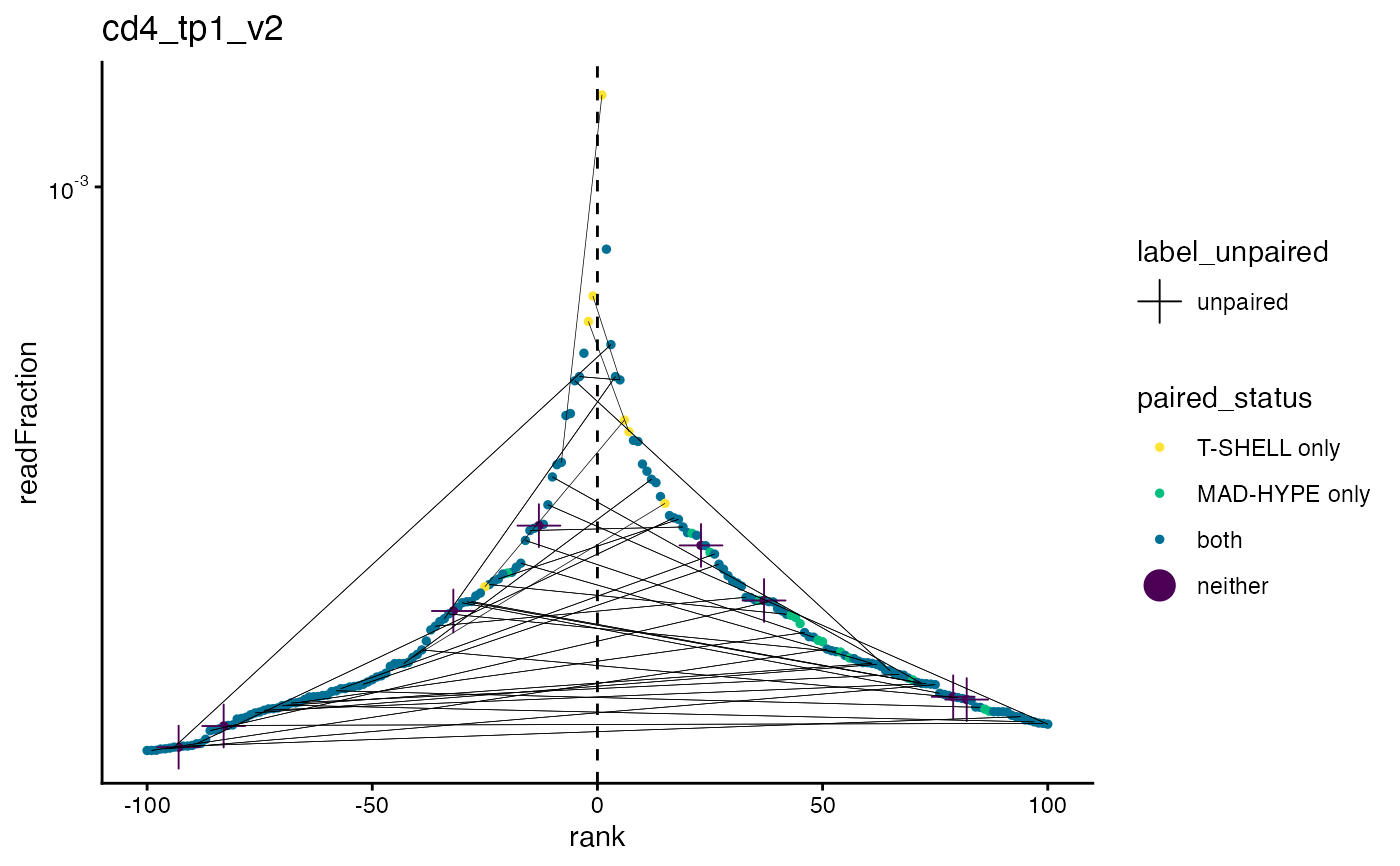
A connected point plot of read fraction vs. rank for the most frequent alpha/beta chains
plot_pairs_with_eachother.Rd![[Experimental]](figures/lifecycle-experimental.svg) This function creates a point plot of read fraction vs. rank for the N most frequent alpha (left, mirrored)
and beta (right) chains with lines between alpha and beta chains indicating a
pair and a cross indicating an unpaired single-chain.
This function creates a point plot of read fraction vs. rank for the N most frequent alpha (left, mirrored)
and beta (right) chains with lines between alpha and beta chains indicating a
pair and a cross indicating an unpaired single-chain.
Usage
plot_pairs_with_eachother(
  data,
  sample,
  n_max = 100,
  show_num_partners = FALSE,
  color_scheme = NULL
)Examples
folder = system.file("extdata/SJTRC_TIRTL_seq_longitudinal", package = "TIRTLtools")
ts_data = load_tirtlseq(folder, meta_columns = c("marker", "timepoint", "version"), sep = "_", verbose = FALSE)

plot_pairs_with_eachother(ts_data, sample = 1, n_max = 100)


plot_pairs_with_eachother(ts_data, sample = 1, n_max = 100, show_num_partners = TRUE)