Plot the overlap/agreement between samples (in terms of most frequent clones)
plot_sample_overlap.Rd![[Experimental]](figures/lifecycle-experimental.svg) This function returns a heatmap showing the overlap among the most frequent
This function returns a heatmap showing the overlap among the most frequent
n_seq TCRs (default is n_seq=200) among pairs of samples in a dataset.
Usage
plot_sample_overlap(
  data,
  chain = c("paired", "alpha", "beta"),
  n_seq = 200,
  show_row_names = FALSE,
  show_column_names = FALSE,
  label_col = "Sample",
  title = "",
  return_data = FALSE,
  cluster_rows = TRUE,
  cluster_cols = TRUE
)

sample_overlap(...)
Arguments
- data
the dataset, an object loaded using the
load_tirtlseq()function- chain
which chain to plot: either paired or alpha-/beta-pseudobulk. (default "paired")
- n_seq
the number of most frequent TCR sequences to use (default 200)
- show_row_names
whether to show row names for the heatmap (default FALSE)
- show_column_names
whether to show column names for the heatmap (default FALSE)
- label_col
a column of the metadata to use as labels for rows and columns (default "Sample", uses the sample_id)
- title
a title for the heatmap
- return_data
whether to return the data used for plotting (a matrix with the overlap values) instead of a heatmap (default is FALSE)
- cluster_rows
whether to cluster the rows of the heatmap (default TRUE)
- cluster_cols
whether to cluster the columns of the heatmap (default TRUE)
Value
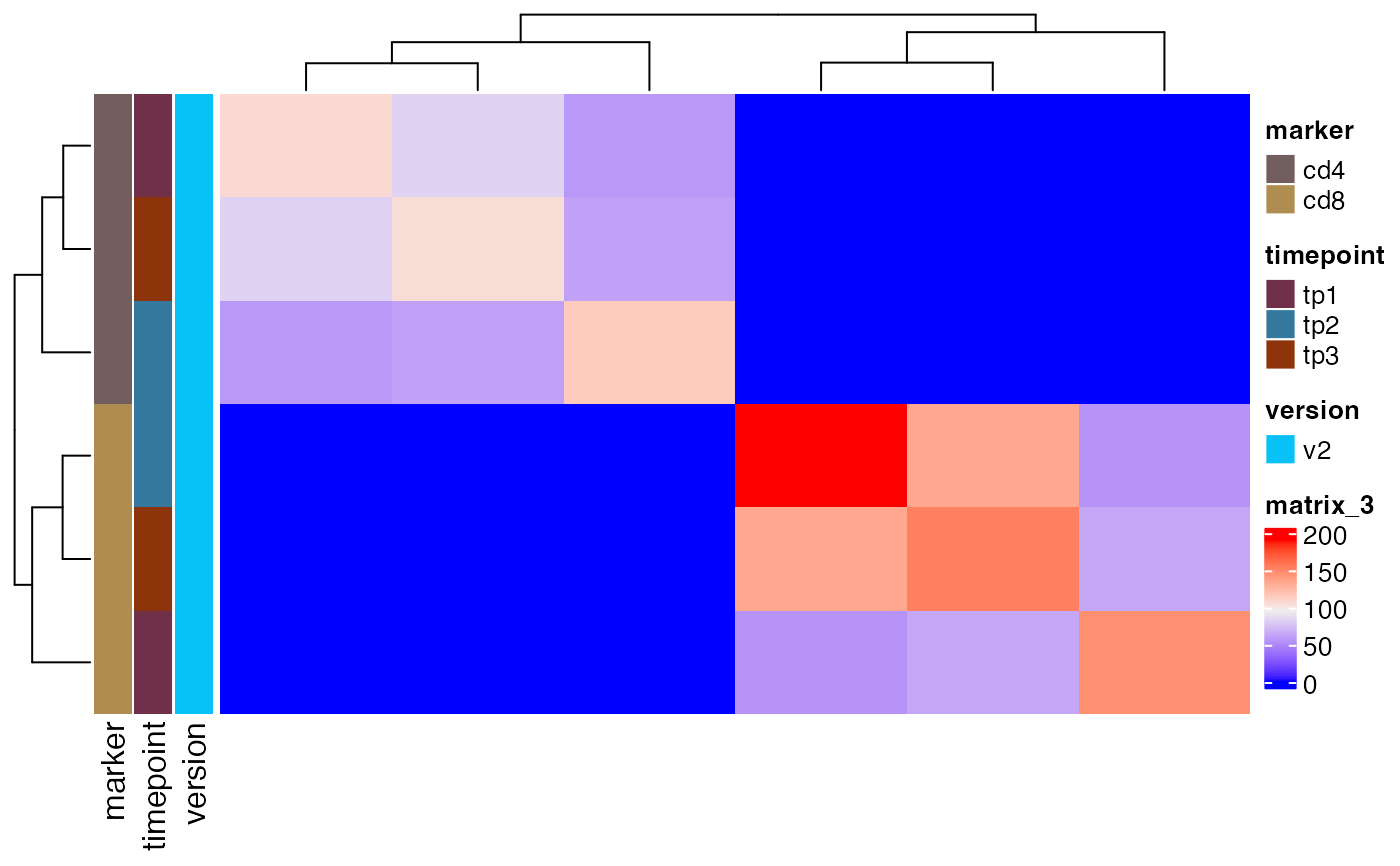
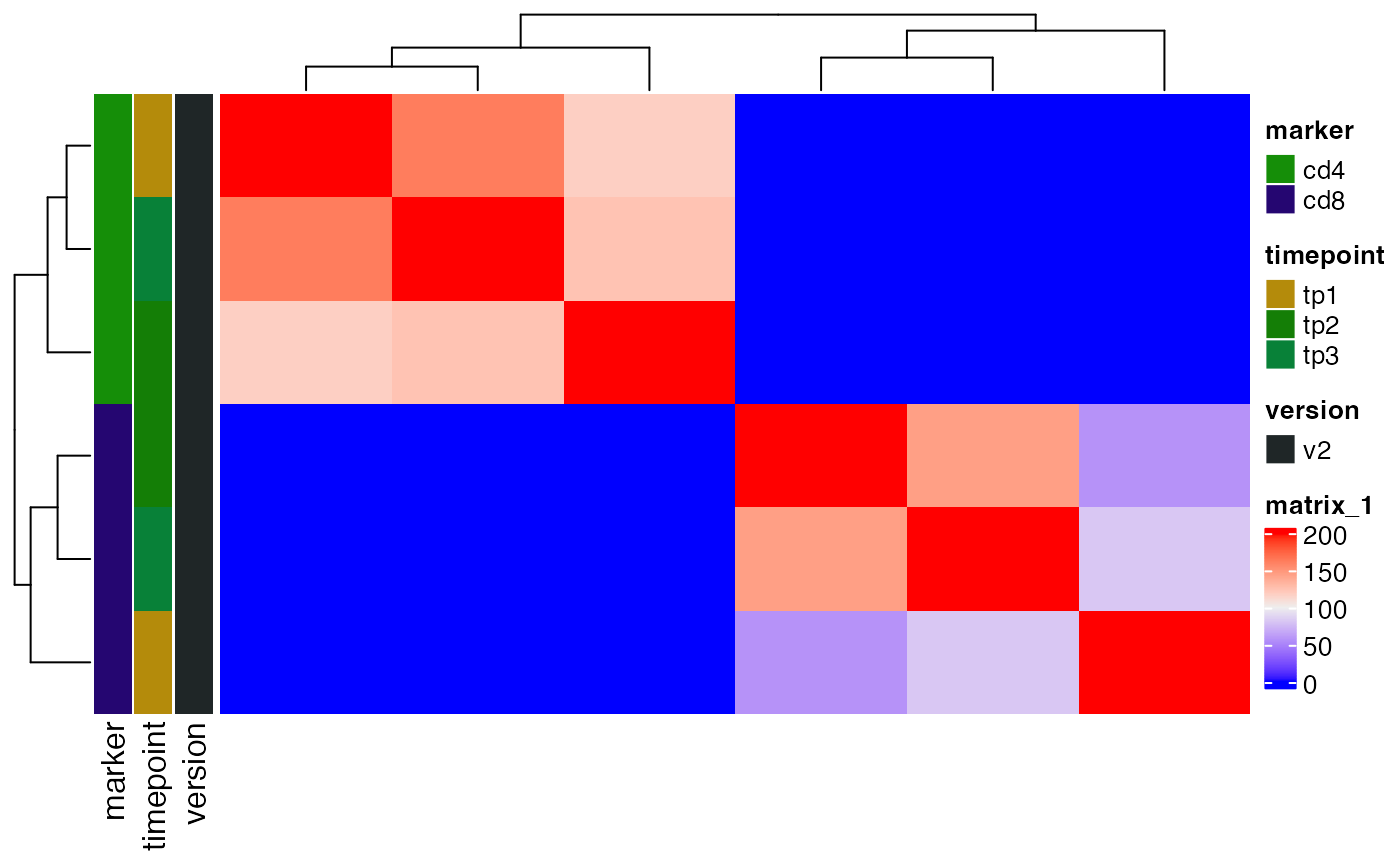
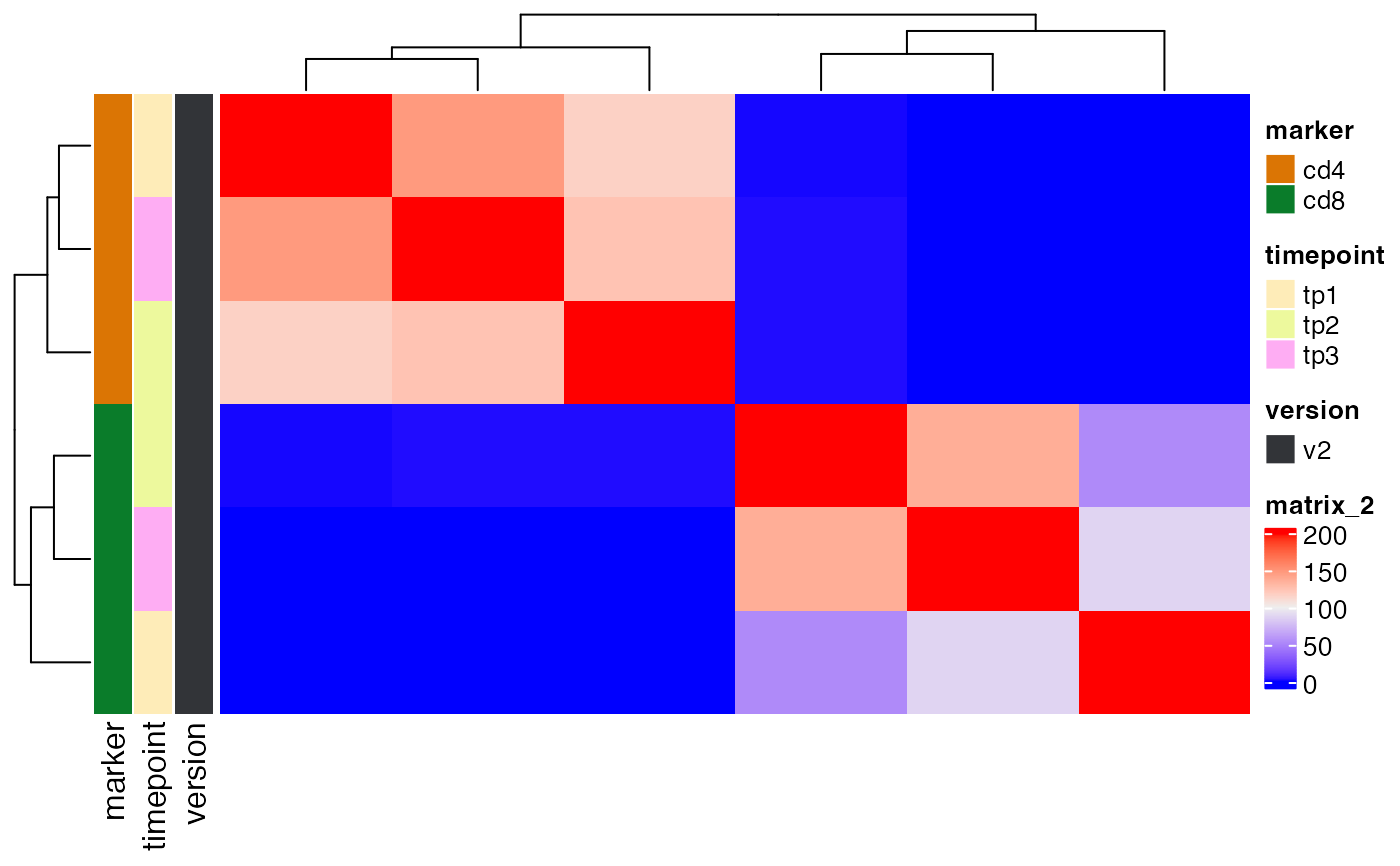
A heatmap with hierarchically clustered rows and columns showing the number of TCRs shared between each pair of samples, among their top N most frequent TCRs.
If return_data is TRUE, a matrix of overlap values will be returned instead.
See also
Examples
folder = system.file("extdata/SJTRC_TIRTL_seq_longitudinal", package = "TIRTLtools")
ts_data = load_tirtlseq(folder, meta_columns = c("marker", "timepoint", "version"), sep = "_", verbose = FALSE)

plot_sample_overlap(ts_data, chain = "beta")

plot_sample_overlap(ts_data, chain = "alpha")

plot_sample_overlap(ts_data, chain = "paired")