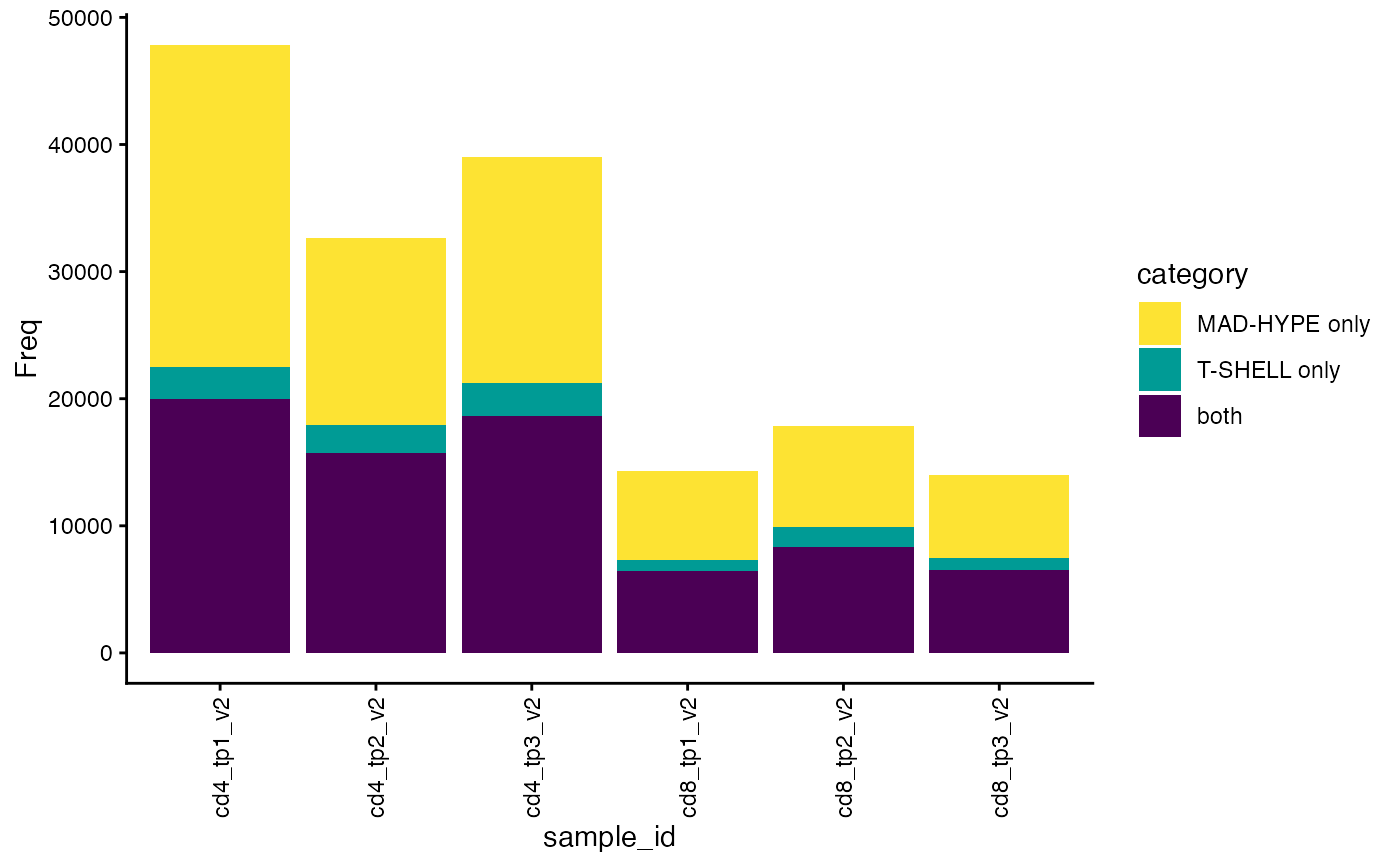
Stacked bar plot of the number of TCRs paired by each algorithm
plot_paired.Rd![[Experimental]](figures/lifecycle-experimental.svg) This function plots the number of TCRs paired by each algorithm. It can also plot the number
of single-chains (alpha or beta) paired by the algorithms.
This function plots the number of TCRs paired by each algorithm. It can also plot the number
of single-chains (alpha or beta) paired by the algorithms.
Usage
plot_paired(
  data,
  chain = c("paired", "alpha", "beta"),
  samples = NULL,
  by_method = TRUE,
  color_scheme = NULL
)
Arguments
- data
a TIRTLseqDataSet object or a data frame created using
get_pair_stats()- chain
the TCR chain to plot (default is "paired")
- samples
(optional) the samples to include in the plot (default is all)
- by_method
(optional) whether to bars by method (T-SHELL vs. MAD-HYPE)
- color_scheme
(optional) the color scheme for the plot
Value
a ggplot object with a stacked bar chart of the number of pairs called for each sample by each algorithm.
Examples
folder = system.file("extdata/SJTRC_TIRTL_seq_longitudinal", package = "TIRTLtools")
ts_data = load_tirtlseq(folder, meta_columns = c("marker", "timepoint", "version"), sep = "_", verbose = FALSE)

plot_paired(ts_data)