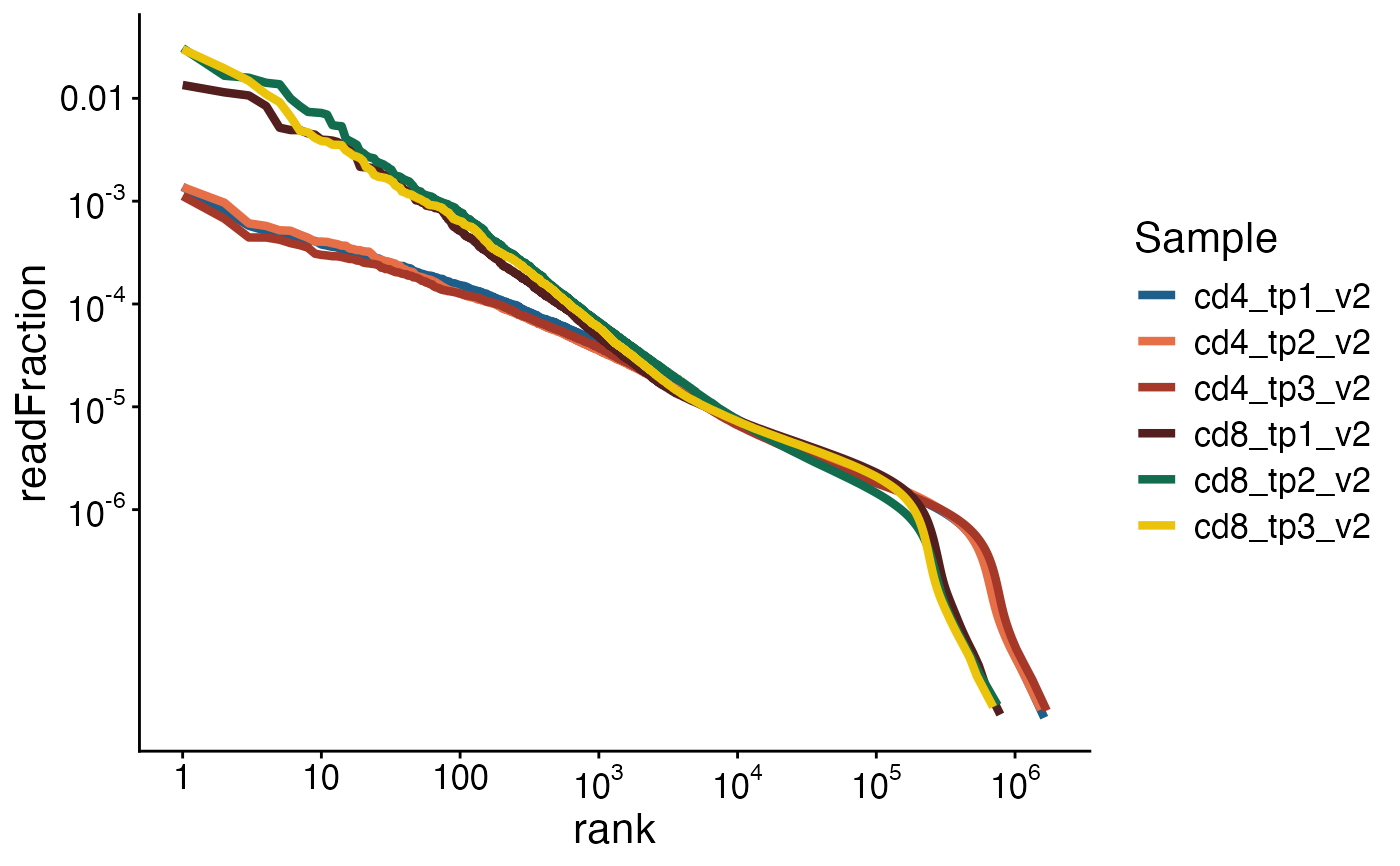
Line plot of clonotype rank vs. read fraction for each sample
plot_ranks.Rd![[Experimental]](figures/lifecycle-experimental.svg)
plot_ranks() returns a line plot of TCR rank vs. read fraction for a given sample.
Usage
plot_ranks(
  data,
  chain = c("beta", "alpha"),
  column = "readFraction",
  color_scheme = NULL
)

rank_plot(...)Examples
folder = system.file("extdata/SJTRC_TIRTL_seq_longitudinal", package = "TIRTLtools")
ts_data = load_tirtlseq(folder, meta_columns = c("marker", "timepoint", "version"), sep = "_", verbose = FALSE)

plot_ranks(ts_data, chain = "beta")