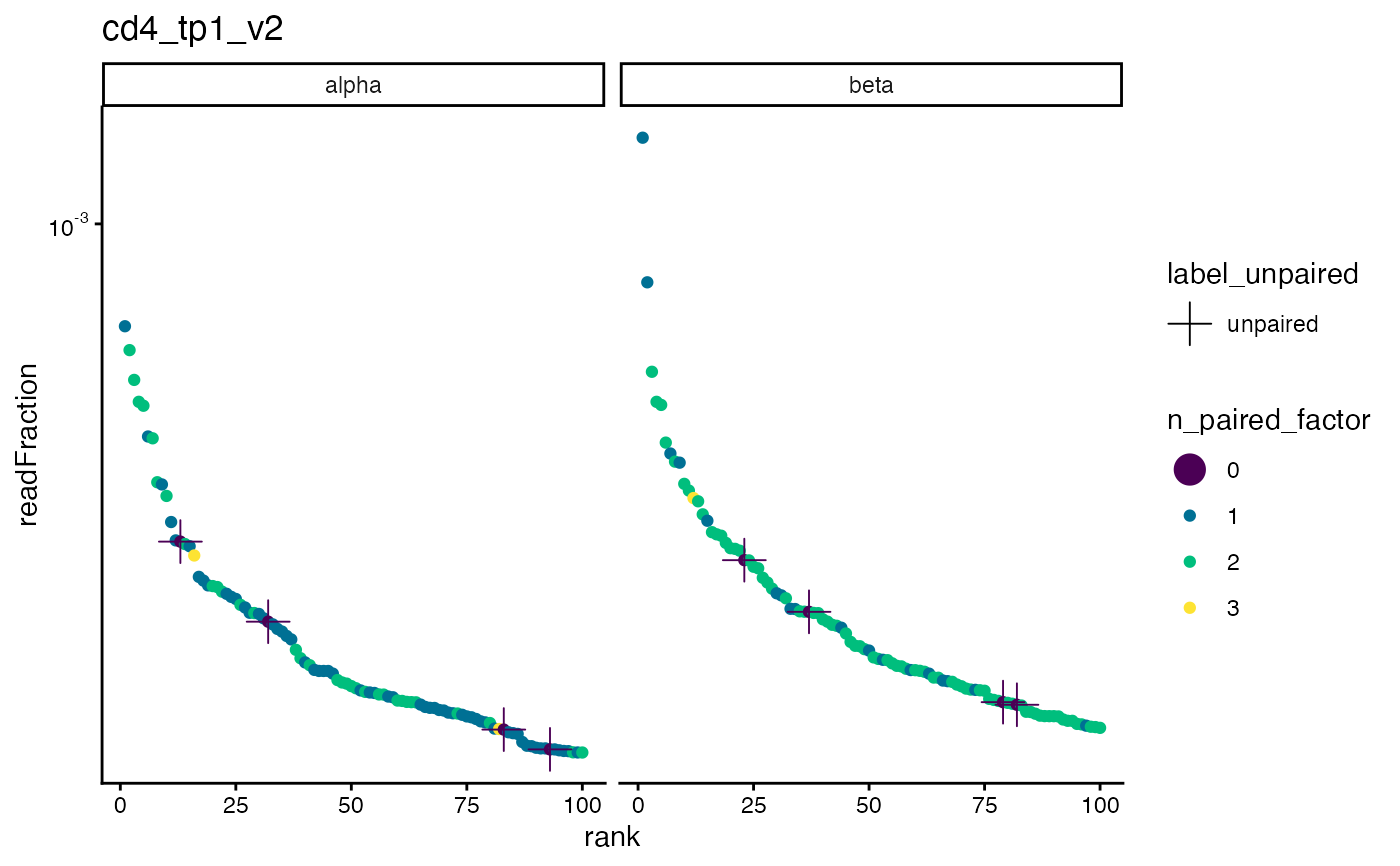
A point plot of read fraction vs. rank for the most frequent alpha/beta chains
plot_read_fraction_vs_pair_status.Rd![[Experimental]](figures/lifecycle-experimental.svg) This function creates two point plots (alpha left, beta right) of the
This function creates two point plots (alpha left, beta right) of the n_max most frequent
single-chains found in a sample.
This function creates a plot similar to plot_pairs_with_eachother(),
but does not mirror the alpha chains plot and add connections between paired alpha and beta chains.
Usage
plot_read_fraction_vs_pair_status(
  data,
  sample,
  chain = c("both", "beta", "alpha"),
  n_max = 100,
  show_num_partners = F,
  color_scheme = NULL
)
Arguments
- data
a TIRTLseqDataSet object
- sample
the sample to plot (either by number or sample id)
- chain
the chain to plot, "alpha", "beta", or "both" (default is "both")
- n_max
the number of most frequent single-chains to plot
- show_num_partners
whether to show the number of partners for each single-chain (default is FALSE)
- color_scheme
(optional) the color scheme for the plot
Examples
folder = system.file("extdata/SJTRC_TIRTL_seq_longitudinal", package = "TIRTLtools")
ts_data = load_tirtlseq(folder, meta_columns = c("marker", "timepoint", "version"), sep = "_", verbose = FALSE)

plot_read_fraction_vs_pair_status(ts_data, sample = 1, n_max = 100)


plot_read_fraction_vs_pair_status(ts_data, sample = 1, n_max = 100,
show_num_partners = TRUE)
plot_read_fraction_vs_pair_status(ts_data, sample = 1, n_max = 100,
show_num_partners = TRUE)