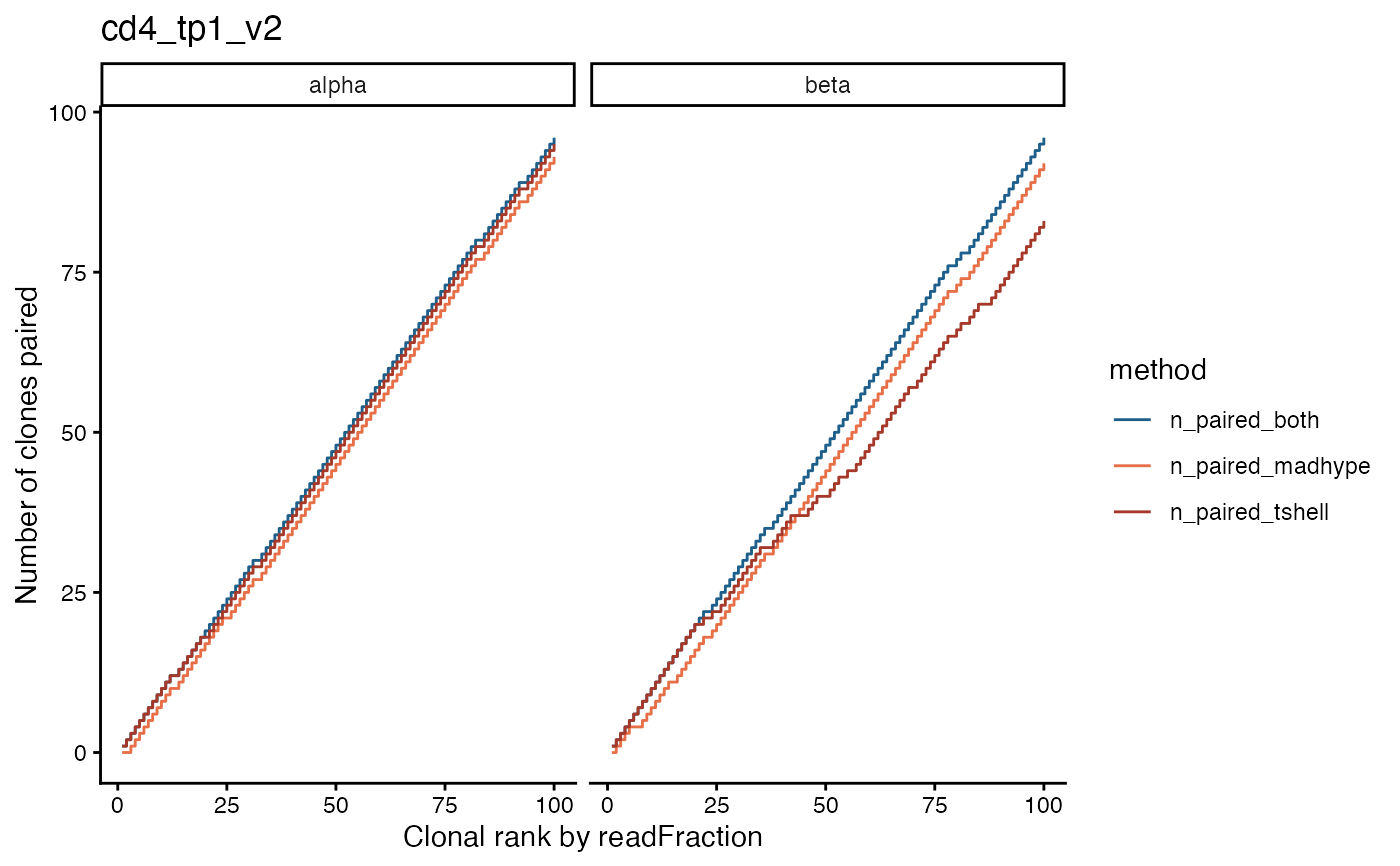
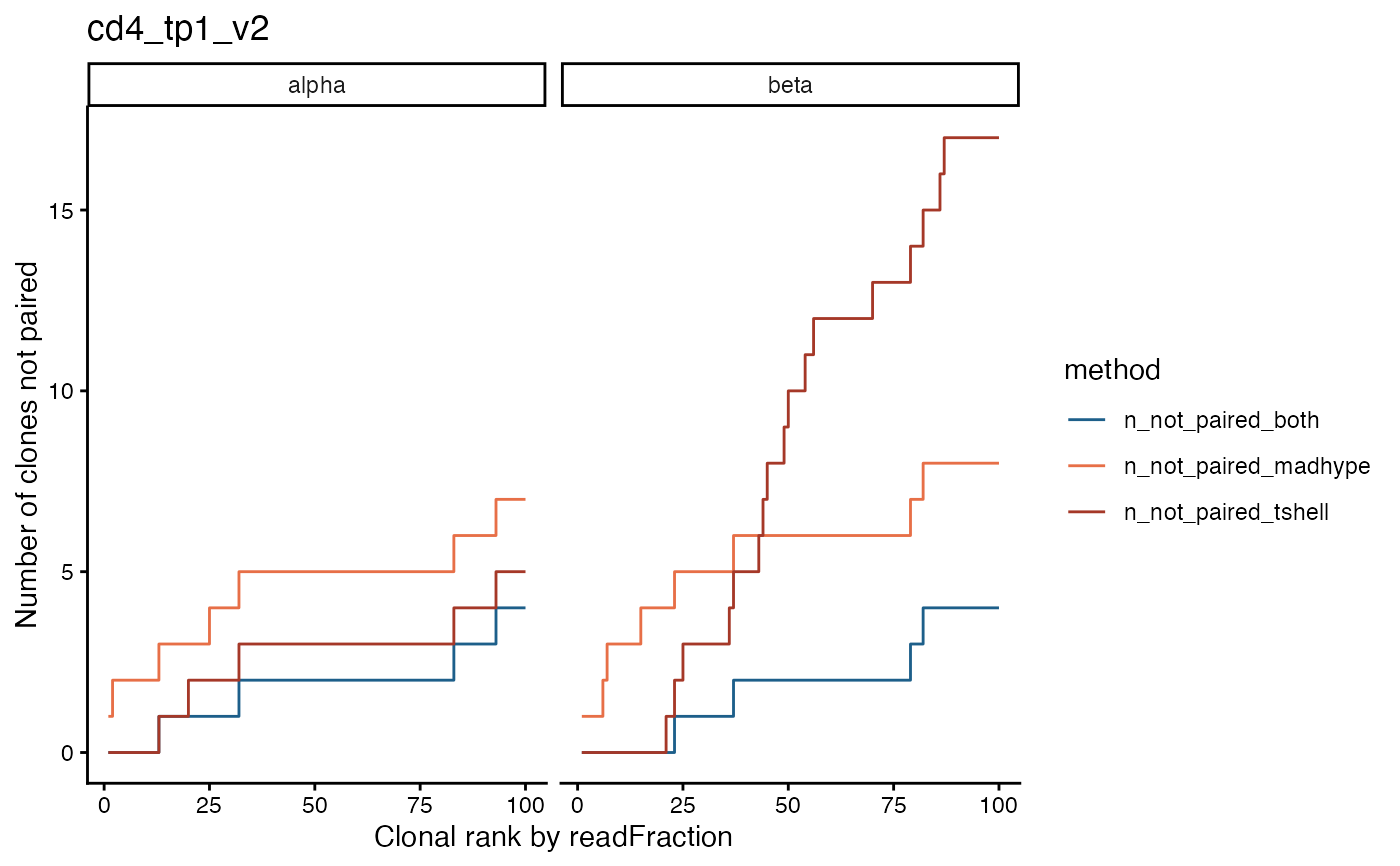
A step plot of the cumulative number of paired/unpaired alpha/beta chains among the most frequent chains
plot_paired_vs_rank.Rd![[Experimental]](figures/lifecycle-experimental.svg) The function creates a stepped line plot of the cumulative number of paired/unpaired alpha
or beta chains (default is both) among the
The function creates a stepped line plot of the cumulative number of paired/unpaired alpha
or beta chains (default is both) among the n_max most frequent chains.
Arguments
- data
a TIRTLseqDataSet object
- sample
the sample to plot (either by number or sample id)
- y_axis
whether to plot the cumulative number of paired or un-paired single-chains (default is "n_not_paired")
- chain
the TCR chain to plot (default is both alpha and beta)
- n_max
the number of most frequent single-chains to plot
- color_scheme
(optional) the color scheme for the plot
Examples
folder = system.file("extdata/SJTRC_TIRTL_seq_longitudinal", package = "TIRTLtools")
ts_data = load_tirtlseq(folder, meta_columns = c("marker", "timepoint", "version"), sep = "_", verbose = FALSE)

plot_paired_vs_rank(ts_data, sample = 1, y_axis = "n_not_paired", chain = "both", n_max = 100)


plot_paired_vs_rank(ts_data, sample = 1, y_axis = "n_paired", chain = "both", n_max = 100)